 |
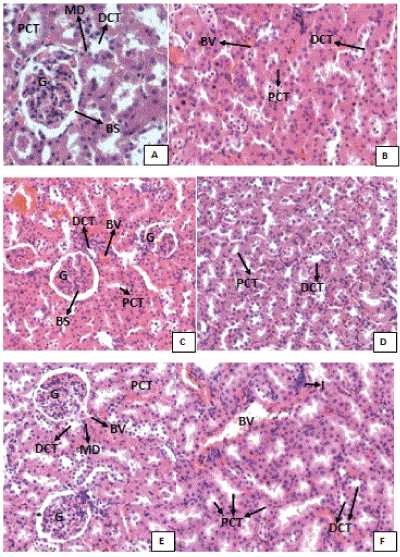
| Figure 3: Photomicrographs of kidney sections of control group rats (A & B), rats treated with 200 mg/kg (C & D), Rats treated with 600 mg/kg body weight/day (E&F) of the aqueous leaves extract of T. schimperi. G=Glomeruli, BS=Bowman’s space, DCT=Distal convoluted tubule, PCT=proximal convoluted tubule, I=Infiltration, MD=Macula densa, BV=Blood vessel. (Sections were stained with H & E). |