 |
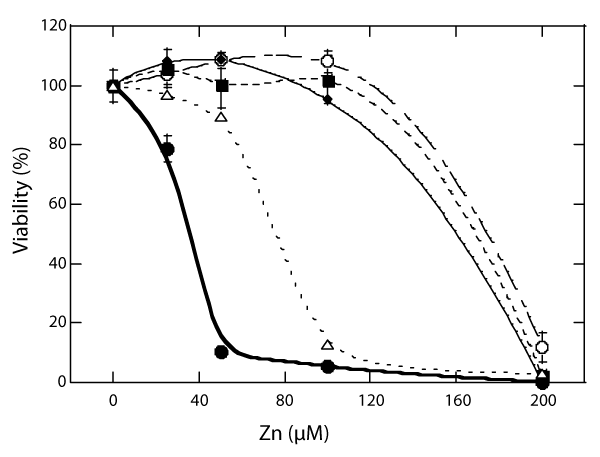
| Figure 1: Zn-induced death of GT1-7 cells and other neuronal cells. Various concentrations of ZnCl2 were administered to B-50 cells (open circle;○), PC-12 cells (closed square; ■), GT1-7 cells (closed circle; ●), and primary cultured neurons from rat cerebral cortex (closed diamond; ♦), or hippocampus (open triangle; △). After 24-h exposure, cell viability was measured using WST-1 method. Data are presented as mean ± S.E.M., n=6. |