 |
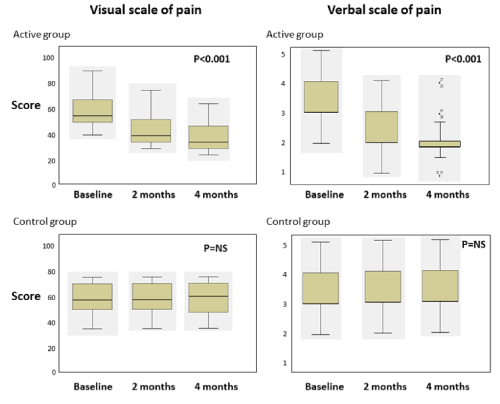
| Figure 2: Pain perception in patients in the active and the control group across the follow-up period. Data are median, interquartile range, 2.5 and 97.5 percentiles. The P value in the figure represents the comparison of pain perception and quality of sleep throughout the three points in time, i.e. it compares the observed effect simultaneously among baseline, 2 months and 4 months assessments (ANOVA test). NS=Not significant. |