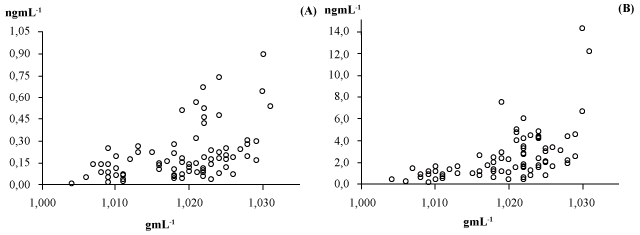
Figure 2:
Correlation between USG (x-axis) and the uncorrected concentrations (y-axis) of salmeterol (A) and α-hydroxysalmeterol (B).