 |
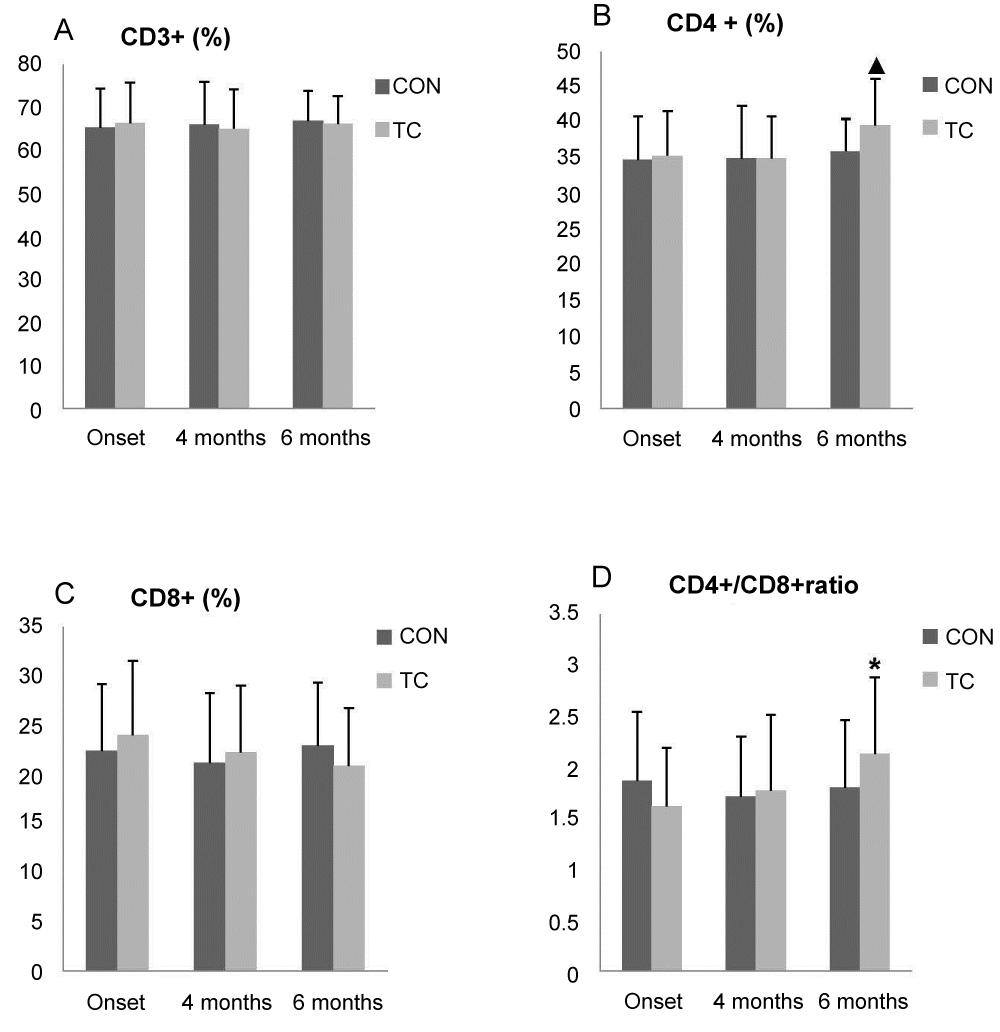
| Figure 1: Comparison of the percentages of T lymphocyte CD3+ (A), and their subsets CD4+ (B) and CD8+ (C) in the peripheral blood, as well as CD4+/CD8+ ratio (D) at the onset, 4 months and 6 months during the study period in control (CON) group and Tai Chi (TC) exercise group. Data are presented as Mean ± SEM. P values were analyzed by Student’s paired t-test (n=3subjects per group). * p<0.05 as compared with onset of the same group▲;p<0.05 as compared with 4 months of the same group. |