 |
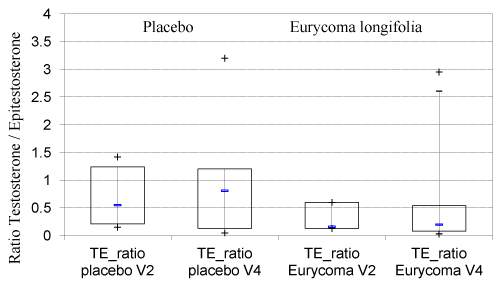
| Figure 1: Box-whisker-plot of the ratio testosterone (T) to epitestosterone (E) at baseline (V2) and end of trial after 12 weeks (V4) for both treatment groups. Shown are the median (small line within the box) with interquartile range ICR (upper and lower quartile), 5th and 95th percentiles and minimum and maximum values (+). |