 |
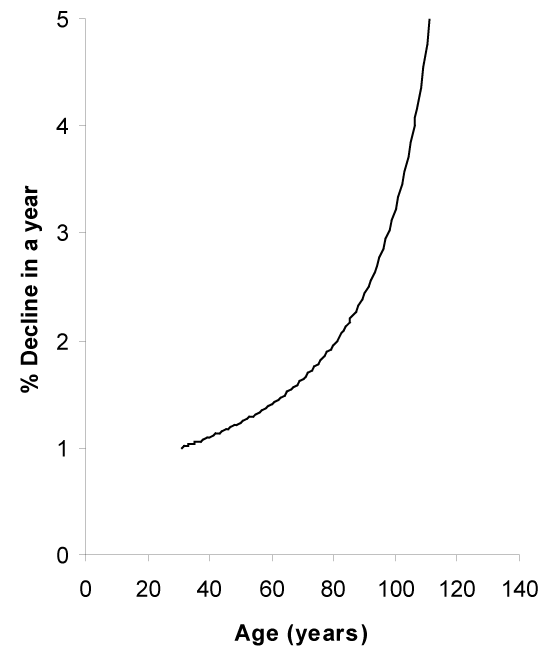
| Figure 3: Figure 2 shows a linear age-related decrease in a functional parameter. Compared to the initial functional capacity (here at 30 years) there is a consistent 1% decline of that functional capacity every year. However, the decline in functional capacity in any given year as a % of that functional capacity in the previous year shows an exponential rise in the rate of decline during ageing, as illustrated here. This can be interpreted as an increasing rate of 'damage' development during ageing. |