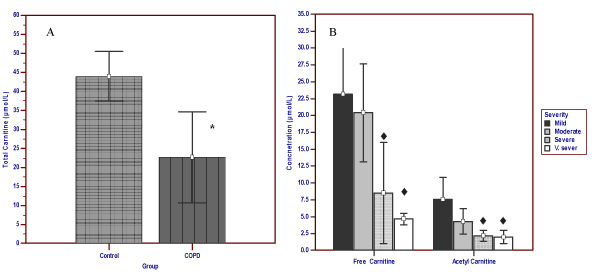
*: P value {0.05 significant difference versus control group
 |
| ♦: P value<0.05 significant difference versus mild COPD *: P value {0.05 significant difference versus control group |
| Figure 1: Total, free and acetyl carnitine in COPD patients and healthy controls. Bars represent the mean values of different analytes in the studied groups. |