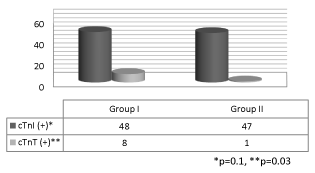
Figure 1:
The rates of positivity of cTnI and cTnT in group I and II.