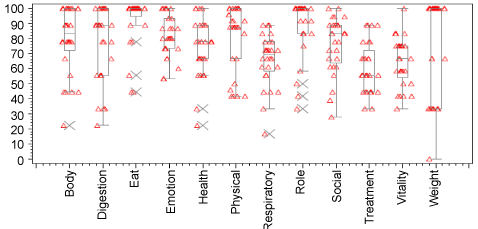
Figure 1 shows box-plots for the scaled scores for each of the Cystic Fibrosis Questionnaire (CFQ-R) domains. The y-axis is the CFQ-R scale. Variability can be seen to be large within this relatively small study population. X shows outlier values
|
| Figure 1: Boxplots for Cystic Fibrosis Questionnaire domains. Figure 1 shows box-plots for the scaled scores for each of the Cystic Fibrosis Questionnaire (CFQ-R) domains. The y-axis is the CFQ-R scale. Variability can be seen to be large within this relatively small study population. X shows outlier values |