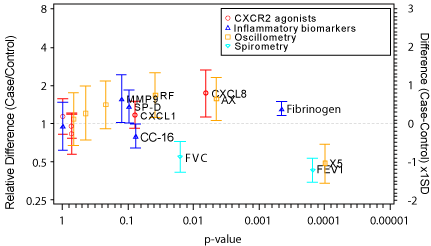
For each endpoint the significance of the non-parametric comparison between the two groups is plotted on the horizontal scale, with the corresponding estimate and 95% confidence interval from the ANOVA for the ratio or standardized-difference between the groups on the vertical scale. Variables with p-values <0.1 have been labeled.