|
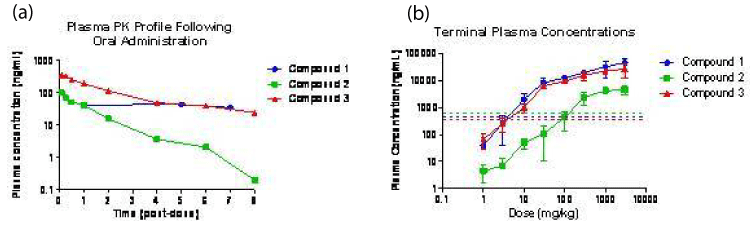
| Figure 3: Plasma PK profiles of compounds 1, 2 and 3 Rats were dosed orally with compound 1, 2 and 3 and plasma concentrations (normalised to a 1mg/kg oral dose) plotted over time (a). Terminal plasma samples from the efficacy study are also plotted by dose group (b). The rat whole cell IC50 values for each compound are represented by the dashed line |