 |
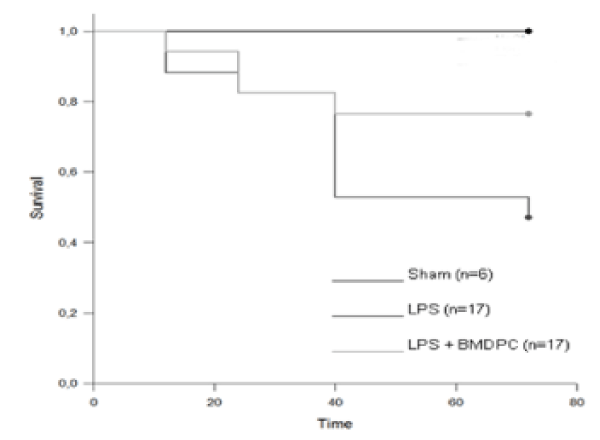
| Figure 1: Mortality of the investigated animals. The Kaplan-Meier survival curve compares the mortality in the non-treatment (LPS, dark grey) versus treatment (LPS+BMDPC, light grey) group versus the control (Sham, black) group. Sham, end point after single saline infusion; LPS, endpoint after single lipopolysaccha-ride nebulization; LPS+BMDPC, end point after single lipopolysaccharide nebulisation plus single bone marrow-derived progenitor cells injection. |