 |
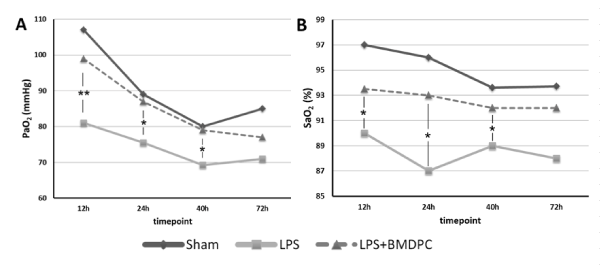
| Figure 4: Blood gas analysis of all studied subjects. The PaO2 (A) und SaO2 (B) 72 hoursafter animals had either received sodium chloride (Sham) (control group, black line), lipopolysaccharide (LPS) only (non-treatment group, gray line) or LPS plus application of bone marrow-derived progenitor cells (BMDPC) (treatment group, dashed line), **p<0.01, *p<0.05 (values displayed as mean) non-treatment versus treatment group. |