 |
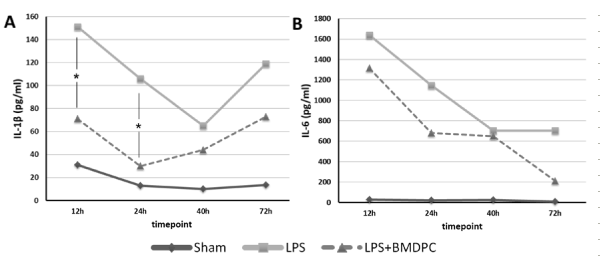
| Figure 5: Serum concentration of proinflammatory cytokines. The serum concentrations of interleukin (IL)-1 (A) and IL-6 (B) over the course of 72 hours in the control (Sham, black line), the non-treatment (LPS, gray line) and the treatment group (LPS+BMDPC, dotted line); *p<0.05 (values displayed as mean) non-treatment versus treatment group. |