 |
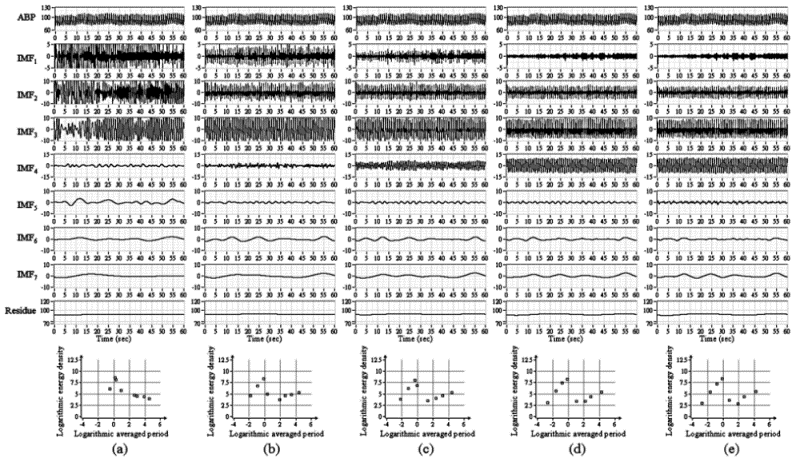
| Figure 1: Results of EMD and CEEMD for ABP signal with different added noise. In all panels, top graph presents the original ABP signal, IMF1-IMF7 and the residue are listed below, and the bottom graph is the characterization plot with logarithmic averaged period and logarithmic energy density of each IMF. (a) EMD of ABP signal, CEEMD with (b) 0.1, (c) 0.2, (d) 1/15 time of standard deviation (SD) of original signal, and (e) 1/10 time of SD of original signal as the SD of noise. |