 |
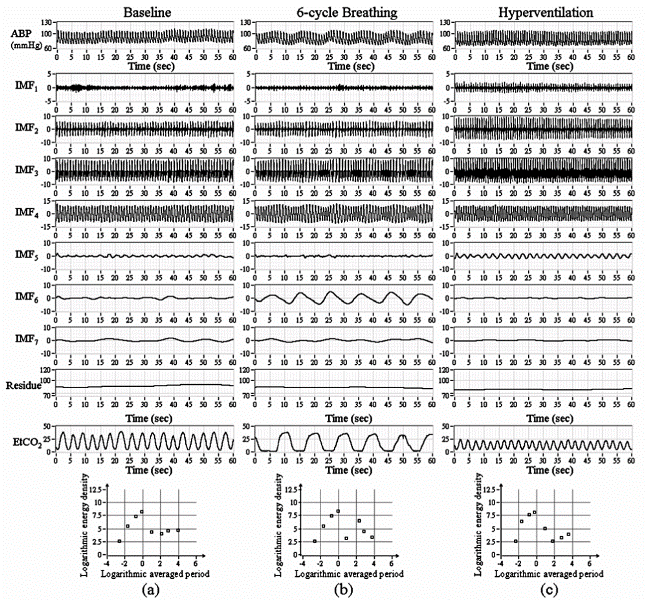
| Figure 3: Results of CEEMD for ABP signal during baseline, 6-cycle breathing and hyperventilation. All panels represent CEEMD of ABP signal, where top graph presents the original ABP signal, IMF1-IMF7 and residue after IMF extracted are listing below, and bottom graph is the corresponding recording of end-tidal CO2 (EtCO2) concentration. (a) baseline resting spontaneous respiration; (b) during paced breathing at 6 cycles per minute. (c) during hyperventilation at 30 cycles per minute. |