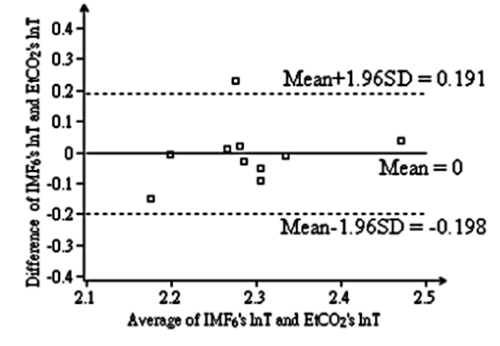
Figure 7:
Agreement between logarithmic averaged period of IMF6 of ABP signal and that of EtCO
2
during 6-cycle breathing by using Bland-Altman plot. The mean difference and the limits of agreement are indicated.