 |
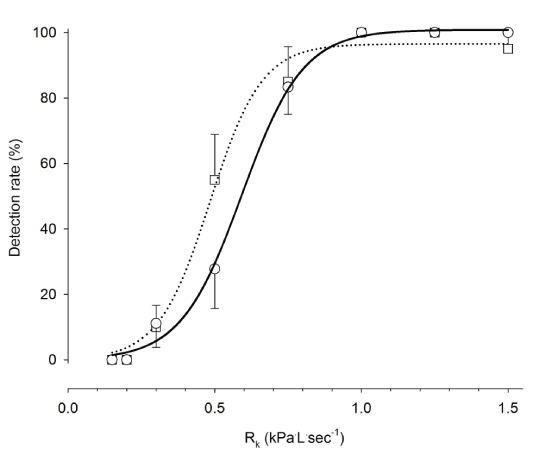
| Figure 3: Load detection in healthy group (mean ± SEM, n=10) of RK during protocol A (□) and B (○). Using non-linear regression a sigmoidal function y=a/(1+e^(-((X-X_0)/b)) ) was applied to each protocol, A: a=96.5, b=0.088, X0=0.49, r2=0.99, p<0.0001, protocol, B: a=100.85, b=0.104, X0=0.59, r2=0.99, p<0.0001. No significant differences were found between protocol A and B, p>0.05. |