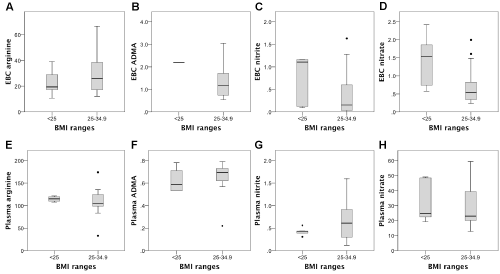
Graphs represent the distribution of concentrations of arginine, ADMA, nitrite and nitrate in EBC (A-D) and plasma (E-H) samples from patients in both BMI ranges. The EBC nitrate concentrations (D) were significantly lower in the BMI 25-34.9 patients than in the BMI<25 group. There was a trend to lower EBC nitrite concentrations (C) in the BMI 25-34.9 group, but it did not reach statistical significance. No significant differences were observed in other studied metabolites in EBC or plasma samples. Bars represent minimum, first quartile, median, third quartile, and maximum values. Outlier values are represented by full dots outside of bars. The logarithmically transformed values were used for statistical analysis, statistical significance accepted as p<0.050.