 |
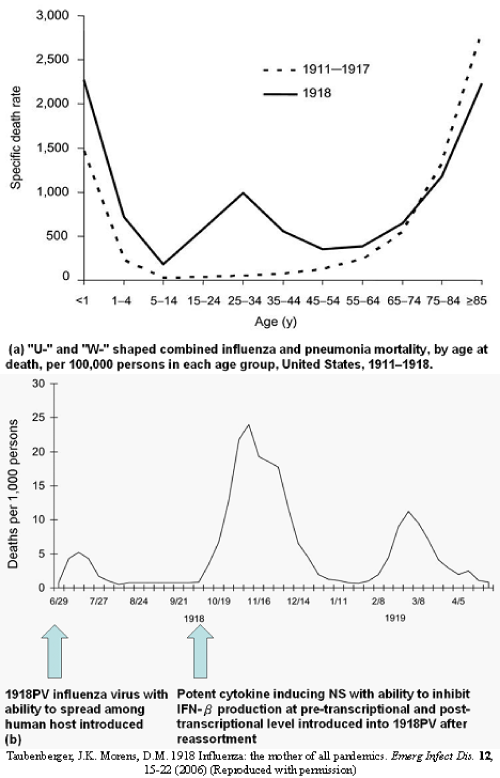
| Figure 1: (a) Schematic diagram showing the W-shaped mortality-age distribution of combined influenza and pneumonia mortality of 1918 H1N1 Spanish influenza pandemic (solid line) in contrast with the U-shaped mortalityage distribution of seasonal influenza in the interpandemic years 1911-1917(dashed line) in the United States. (b) Schematic diagram explaining the surge in mortality in the second wave of 1918 H1N1 Spanish influenza pandemic: The 1918PV with ability to spread among human host was introduced in 1918 in the first wave. The first wave of 1918 H1N1 Spanish influenza pandemic had a mortality comparable to the usual seasonal influenza with a U-shaped mortality-age distribution. Reassortment of an NS with ability to suppress human innate immune response and induce potent cytokine storm through the inhibition of inducible IFN-α production at both the pre-transcriptional and post-transcriptional level into the 1918PV after the first wave had led to a dramatic surge in mortality and a W-shaped mortality-age distribution that involved young adults with a distinct peak of death between 20 and 40 years of age in the second wave of the 1918 H1N1 Spanish influenza pandemic as shown in diagram 1a. |