|
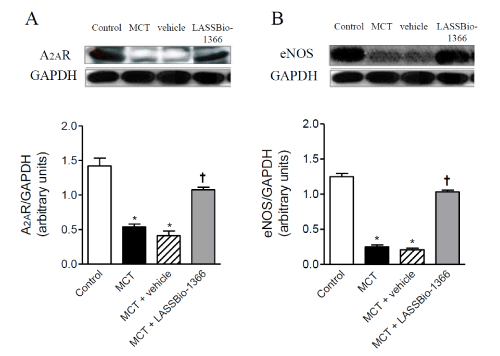
| Figure 5:Western blot analyses of (A) adenosine A2A receptor (A2AR) and (B) endothelial NO synthase (eNOS) expression in lungs from control, monocrotaline (MCT), MCT+vehicle (DMSO), and MCT+LASSBio-1366 groups, respectively. GAPDH was used for normalization. Graphs show protein quantification. Each column represents the mean ± SEM (n=5). *P<0.05 compared to control; †P<0.05 compared to MCT. |