 |
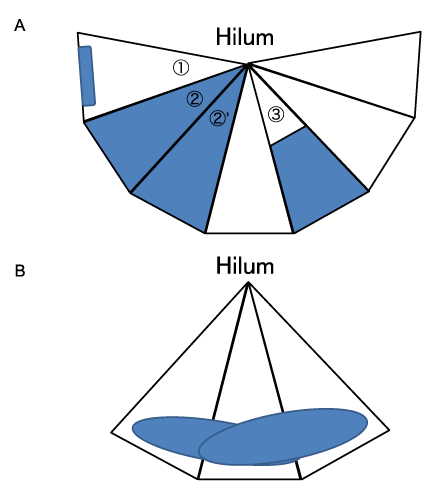
| Figure 3: Diagrammatic illustration of non-segmental distribution of parenchymal abnormalities. (A) Types of non-segmental pattern of consolidationseen in chest CT scans of patients with infectious pneumonia. Figure 2 is an example of type 1, Figure 1 is an example of type 2, and Figure 4 is an example of 2’. (B) Anothertype of non-segmental pattern of consolidation found in chest CT. Figure 7 is an example of this type. |