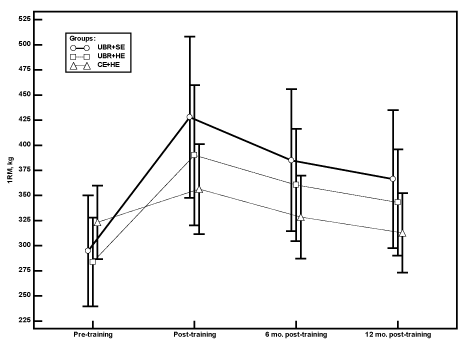
Figure 3:
Changes in the 1RM by group. Symbols (○=UBR+SE group, □=UBR+HE group, Δ=CE+HE group) represent the mean values for the 1RM.