 |
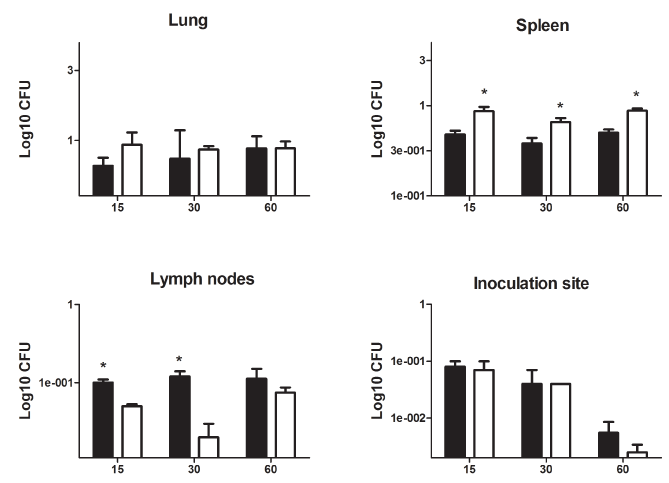
| Figure 2: Bacillary loads at different tissues collected from vaccinated BALB/c mice before challenge: At the indicated time points after vaccination with BCG (white bars) or mce-2A mutant (black bars) and before challenge, animals were sacrificed and the indicated organs were immediately removed, homogenized and plated for CFU quantification. Bars represent the means and standard deviations for four different animals at each time point in two separate experiments. Asterisks represent statistical significance (P< 0.05). |