|
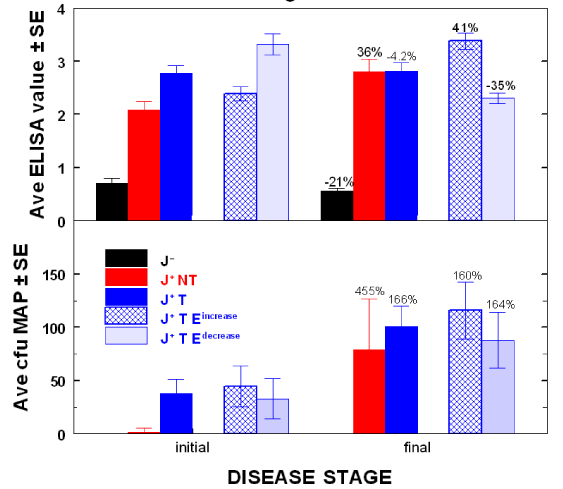
| Figure 4: Changes in mean ELISA OD values and fecal MAP of paratuberculosis- free and positive cows, treated and not treated. Initial and final ELISA OD values are in panel A and fecal values in Panel B. J-- = Johnes diseasefree (n=10); J+ NT = Johnes disease positive, not treated (n=9) J+ T = Johnes disease positive, treated (n=49); J+ T Eincrease = Johnes disease. positive with longitudinal increasing ELISA values (n=20); J+ T Edecrease = Johnes disease positive with longitudinal decreasing ELISA values (n=22) Percentages shown for each group indicate changes relative to initial values. |