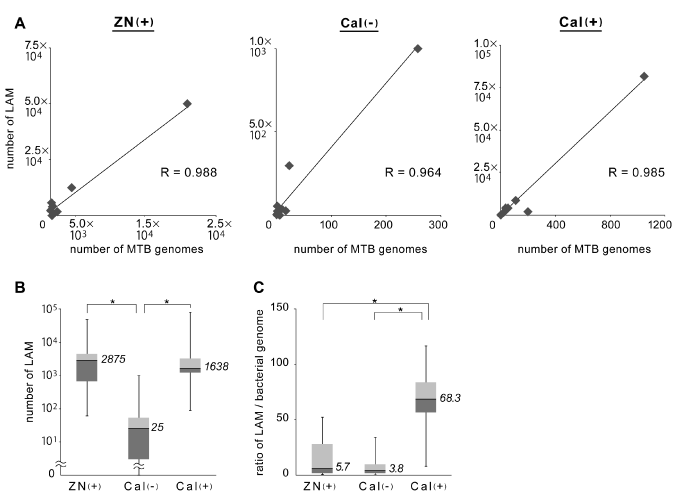
(A) Correlation graphs of the number of LAM-containing granules and the number of bacterial genomes in the three groups. Correlation coefficient=0.988 in ZN(+) group, 0.964 in Cal(-) group, and 0.985 in Cal(+) group. (B) Numbers of LAM-containing granules in the three groups are expressed by boxplots on a logarithmic scale. (C) Ratios of the number of LAM containing granules divided by the number of bacterial genomes in the three groups are expressed by boxplots. n=10 in the ZN(+), 13 in the Cal(-), 11 in the Cal(+). *P<0.05, Steel-Dwass test.