 |
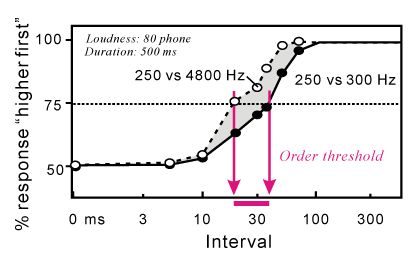
| Figure 2: The mean performance of human adults in ordering which of two pure tones (250 vs. 4800 Hz; 250 vs. 300 Hz) came first. The ordinate gives the percentage of correct ordering: “higher frequency came first” or “lower frequency came first”. The abscissa gives the tone onset interval. The arrows represent the tone interval where the percentage of correct ordering crosses 75% (called “order threshold”). The order threshold resided around 30 ms, with small variance related to difficulties in frequency discrimination (Modified from Hirsh [11]). |