 |
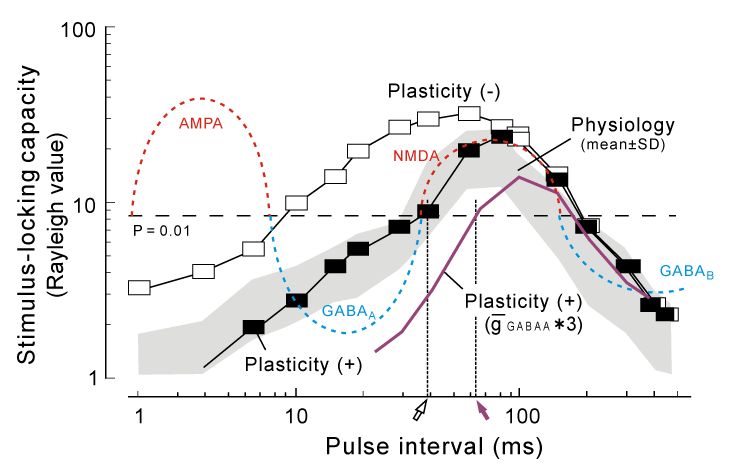
| Figure 11: The temporal modulation transfer function (temporal-MTF) obtained from various conditions. Gray sphere: the mean ± SD of of pooled in vivo data for band-pass type stimulus-locking units (based on Figure 6A-4). Open symbols: prediction from the 4-receptor version model. Filled symbols: prediction from the full version model. Purple lines: prediction from the full version model but the conductance of GABAA-receptor ( g GABAA) was elevated by factor of 3. For comparison purpose, the schematic diagram of the depolarization and hyperpolarization as in Figure 8B was superimposed (broken curve). |