|
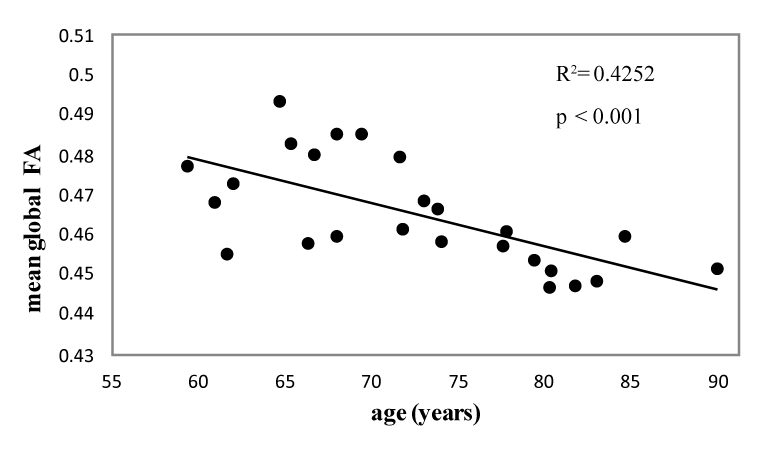
| Figure 1: Scatter plots of the fractional anisotropy (FA) value of global white matter versus age. The linear regression line is superimposed. Simple regression analysis showed a significant negative correlation between mean global FA value and age (R2=0.4252, p<0.001, FA=0.5426–0.001×age). |