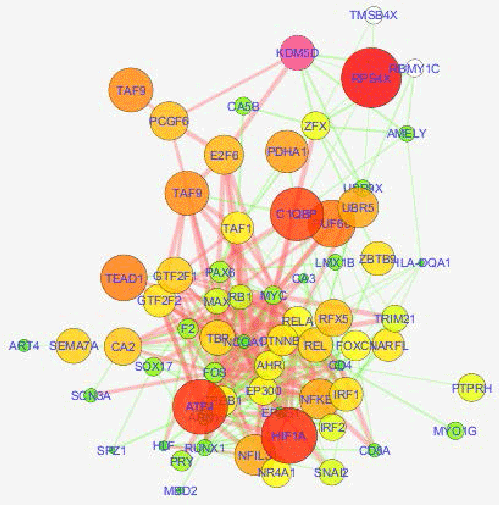
Figure 1:
Gene co-expression network. The nodes and edges show the expression levels and scores predicted from enrichment of data (GEO; GDS3973) [4].