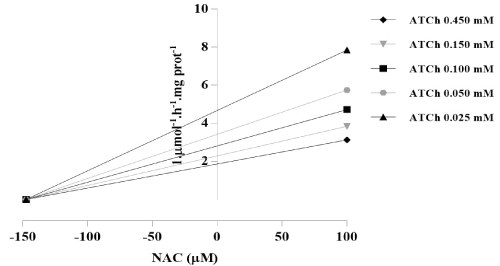
Figure 6:
Dixon plot of NAC inhibitory effect on mice brain AChE activity. Data represent the mean for 5-6 independent biological replicates measurements.