|
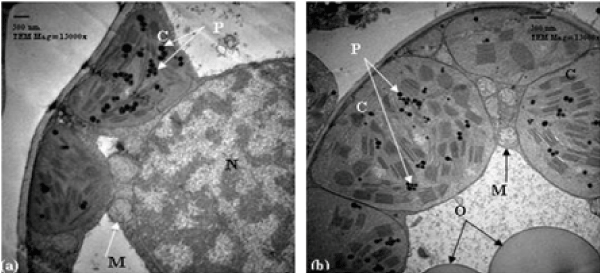
| Figure 2: TEM micrograph of a mesophyll cell from wheat flag leaf (sensitive cultivar at 14 days post-anthesis) (a) treated with 10 % seawater showing normal chloroplasts (C) with many plastoglobuli (P). Note the nucleus (N) and mitochondria (M). Bar = 0.5 μm. (b) treated with 25% seawater showing spherical chloroplasts (C) with many plastoglobuli (P). Note big oleosomes (O) lie in the cytoplasm and many mitochondria (M). Bar = 0.5 μm. |