|
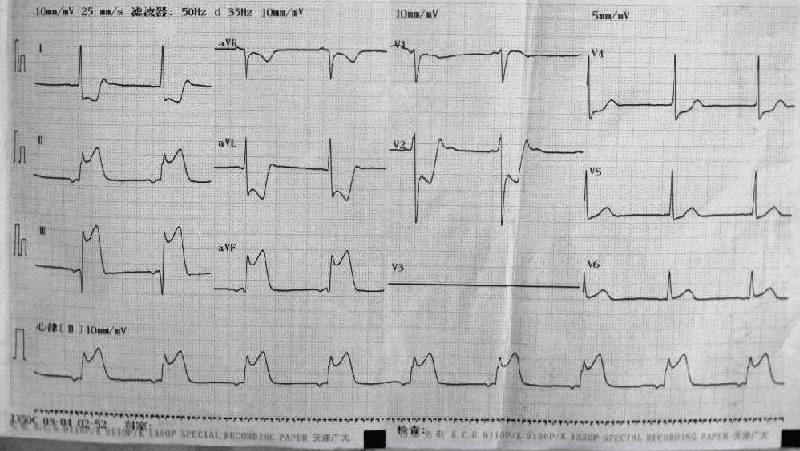
| Figure 1: ECG showing ST elevation (III>II) in the inferior leads and ST depression in lead I, aVL, V2 and V4. The posterior leads V7,V8, V9 of this patients was normal which was shown in figure 2. The coronary angiography later confirmed right coronary artery occlusion. |