 |
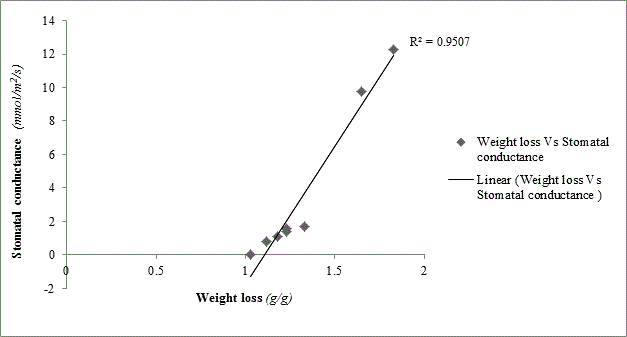
| Figure 1: Graph showing the relationship of weight loss (g/g) and stomatal conductance (mmol/m2/s) on Spathiphyllum sweet checo , X axis showing weight loss of all treatments and Y axis represents stomatal conductance of all treatments. Values are averages of the three leaves per treatment. |