 |
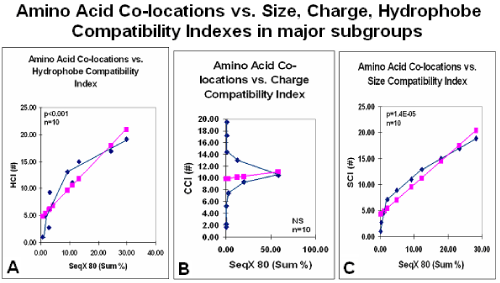
| Figure 8: Amino acid co-locations vs. size, charge and hydrophobe compatibility indexes (SCI, C; CCI, B; HCI, A) in major subgroups. Compatibility indexes were calculated for the 20×20 possible amino acid co-locations. Higher index indicates greater compatibility. A sample containing a total of 34,630 co-locations in 80 different protein structures (SeqX80) were divided into 10 major subgroups and the average frequency (Sum %) of co-locations in each subgroup were plotted against the compatibility indexes. The group averages are connected by the blue lines, while the pink symbols and lines indicate the calculated linear regression [9]. |