 for n = 2, ..., 7 with T = 24) for the parameters given in Table 1.
 |
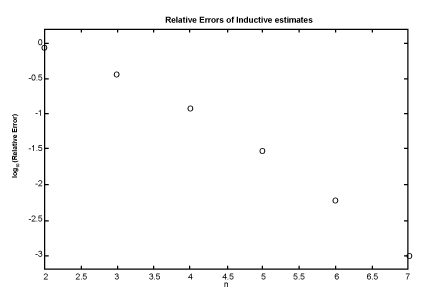
Figure 2:Relative errors of successive inductive approximations (plotted in log10
scale and calculated as  for n = 2, ..., 7 with T = 24) for the parameters given in Table 1. for n = 2, ..., 7 with T = 24) for the parameters given in Table 1. |