 |
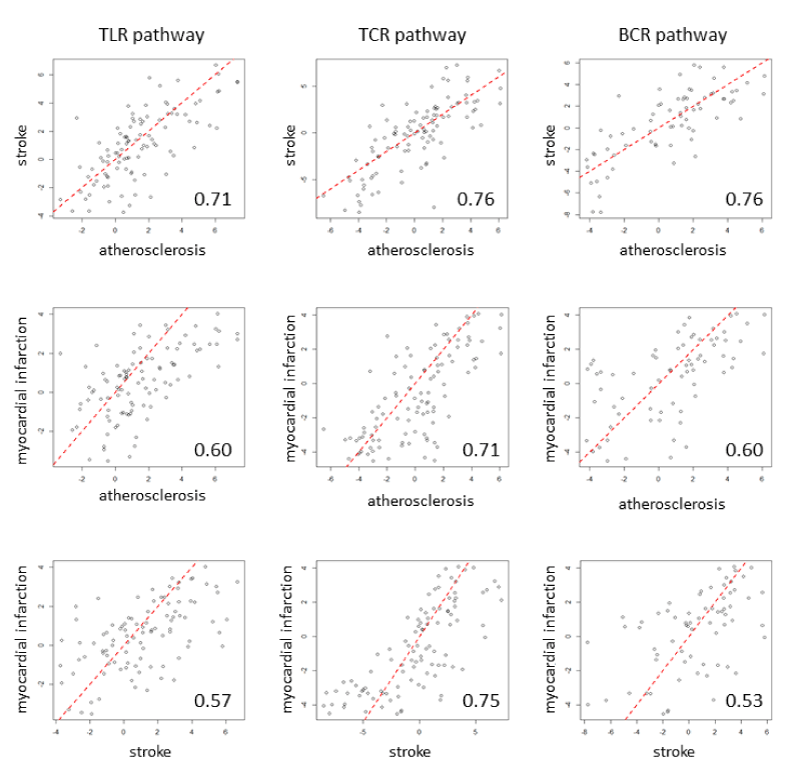
| Figure 1: Concordance of expression changes (indicated by t statistics) in the TLR, TCR, and BCR pathways between cases and controls in atherosclerosis and stroke studies or between 7 hours and 28 hours after myocardial infarction. The number in each panel is the Pearson correlation coefficient. The red dash line is the identity line. |