 |
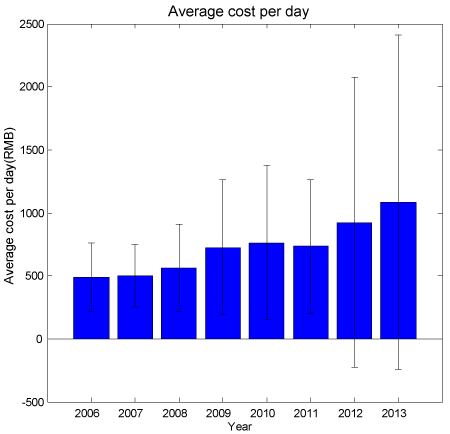
| Figure 3b: Average hospital cost of diabetics per day. Horizontal axis represents the years from 2006 to 2013. Vertical axis represents the mean hospital cost per day. Error bars are marked with standard deviation. The cost of each patient is quite different, so the standard deviation is very large. |