 |
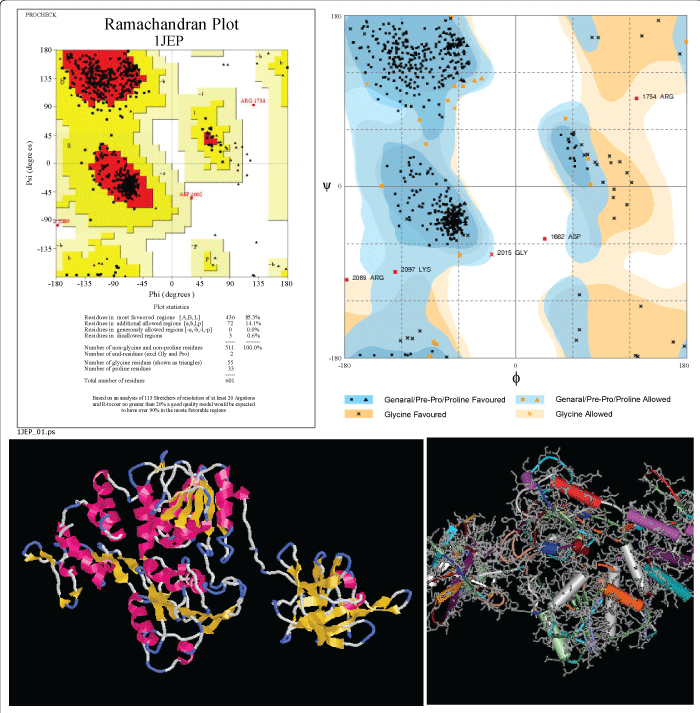
| Figure 1: (A) Predicted 3-D structure of Nucleocapsid protein of JE virus :Ramachandran plot analysis. The Plot statistics are: residues in most favoured regions [A,B,L] - 104 (85.0%); residues in additional allowed regions [a,b,l.p] - 72 (14.1%); residues in generously allowed regions [-a,-b,-l,-p] - 0 (0.0%); residues in disallowed regions – 3(0.6%); number of non-glycine and non-proline residues- 511 (100.0%); number of end residues (excl. Gly and Pro) - 2; number of glycine residues (shown as triangles) - 55; number of proline residues - 33; total number of residues-601. (B) Predicted 3-D structure of Nucleocapsid protein of JE virus. |