|
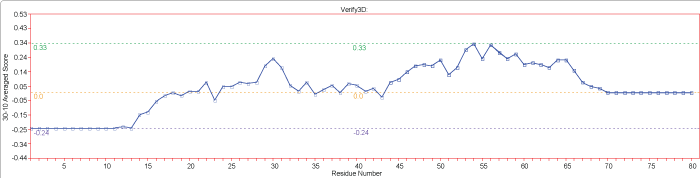
| Figure 2: Verify 3D plot, in the above plot, the vertical axis represents the average 3D-1D profile score for residues in a 21-residue sliding window, the center of which is at the sequence position indicated by the horizontal axis. Scores for the first 9 and the final 9 sequence positions have no meaning. A window length of 21 residues strikes a useful balance between smoothing fluctuations and localizing the error. |