|
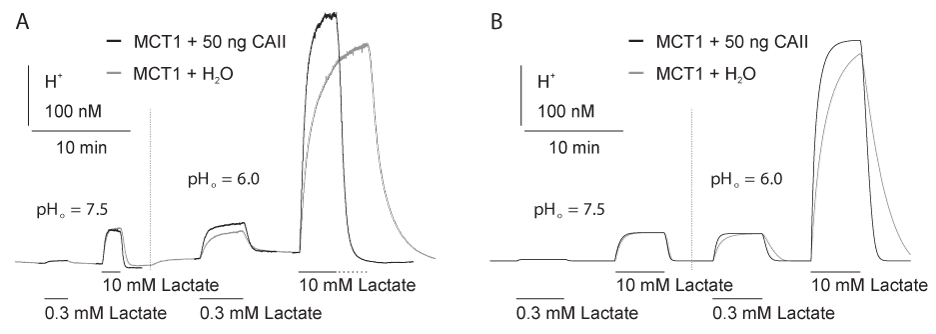
| Figure 5: Dependency of MCT1 transport activity on substrate concentration. (A) Original recordings of the intracellular H+ concentration and (B) simulation of the changes in intracellular H+ concentration in MCT1-expressing oocytes injected with 50 ng of CAII (black trace) or H2O (gray trace), respectively, during application of 0.3 and 10 mM lactate in HEPES buffered solution at pHo 7.5 and 6.0. |