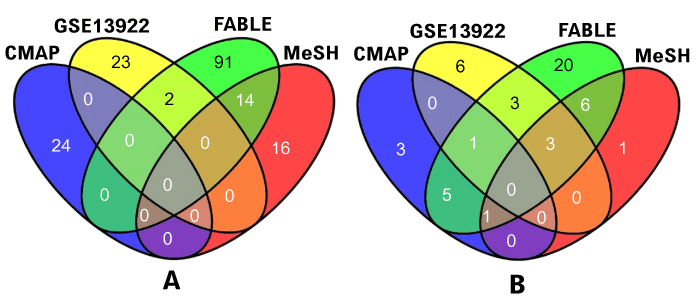
Figure 1:
(A) shows the direct overlap of identified molecular features for the four data sets retrieved, (B) depicts the overlap of pathways following the pathway enrichment analysis.