 |
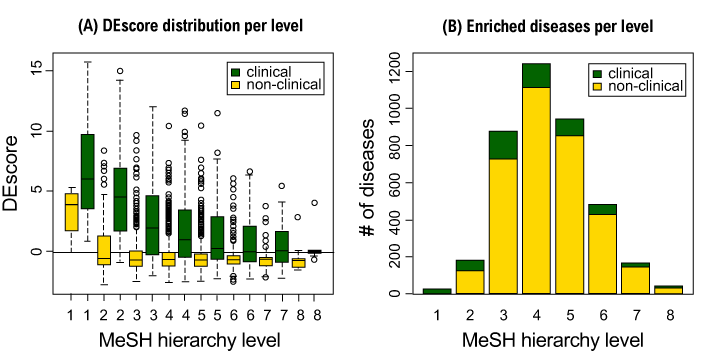
| Figure 2: Disease Enrichment score (DEscore) distribution. (A) depicts the distribution of DEscores for each MeSH hierarchy level (1-8) while also distinguishing between diseases present / absent in MMF related clinical trials. The vertical line represents the overall mean. (B) represents the number of enriched diseases per MeSH hierarchy level, while discriminating for diseases found in MMF-associated clinical trials and others. |