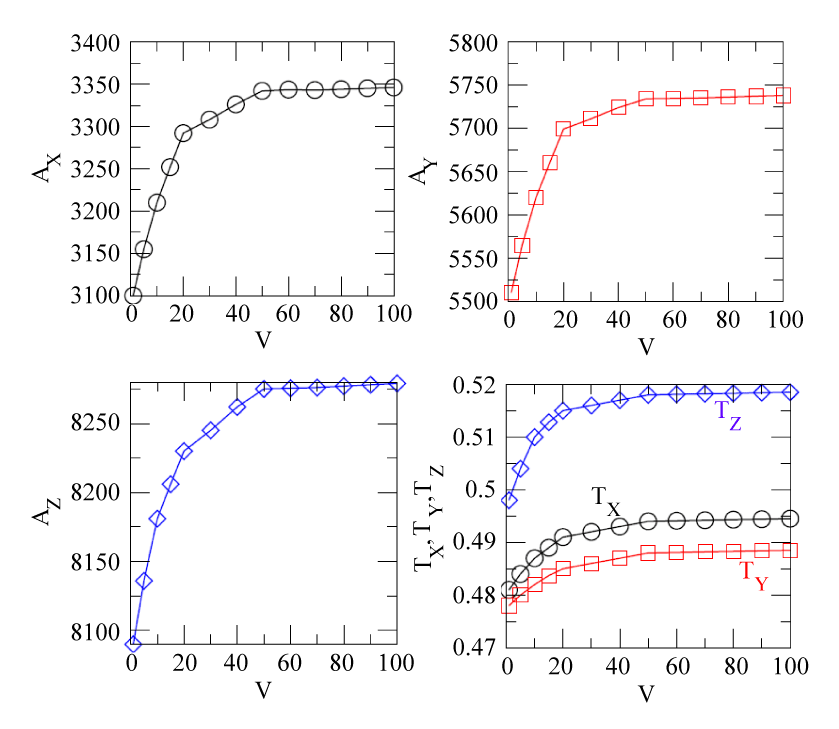
Figure 6:
(a) The plot of amplitude Ac as a function of V for A and R. (b) Plot showing the variation of time period T of A and R with respect to V.