 |
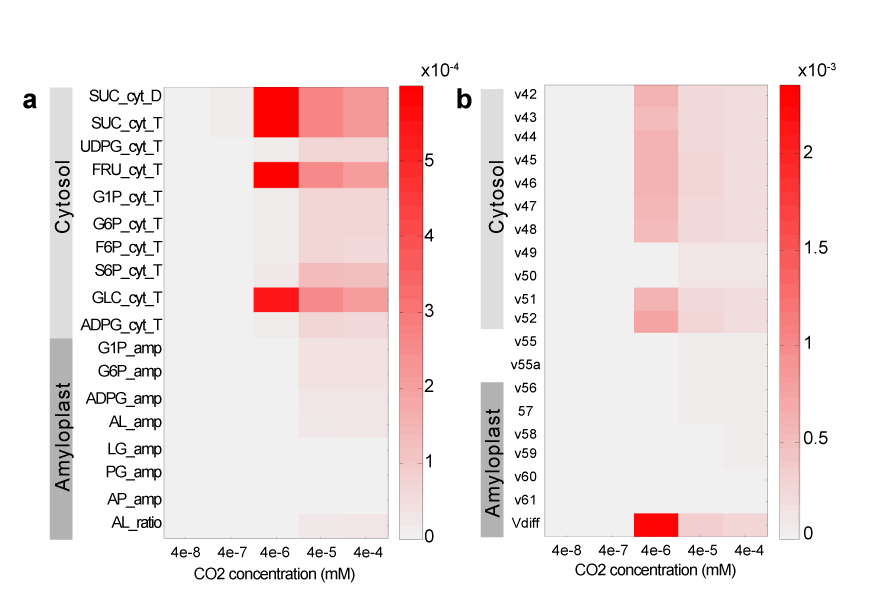
| Figure 4: Changes in metabolism inside the tuber cell under in silico CO2 elevation. Heat map plotting shows the metabolic changes inside the tuber cell under in silico CO2 elevation: (a) metabolite concentrations and (b) fluxes through enzymes in the starch biosynthesis pathway. The colour intensity and tones represent magnitude and direction of metabolic changes, respectively, with the magnitude of change ranging from grey (reference) to red (more deviation from the reference in positive direction). |