 |
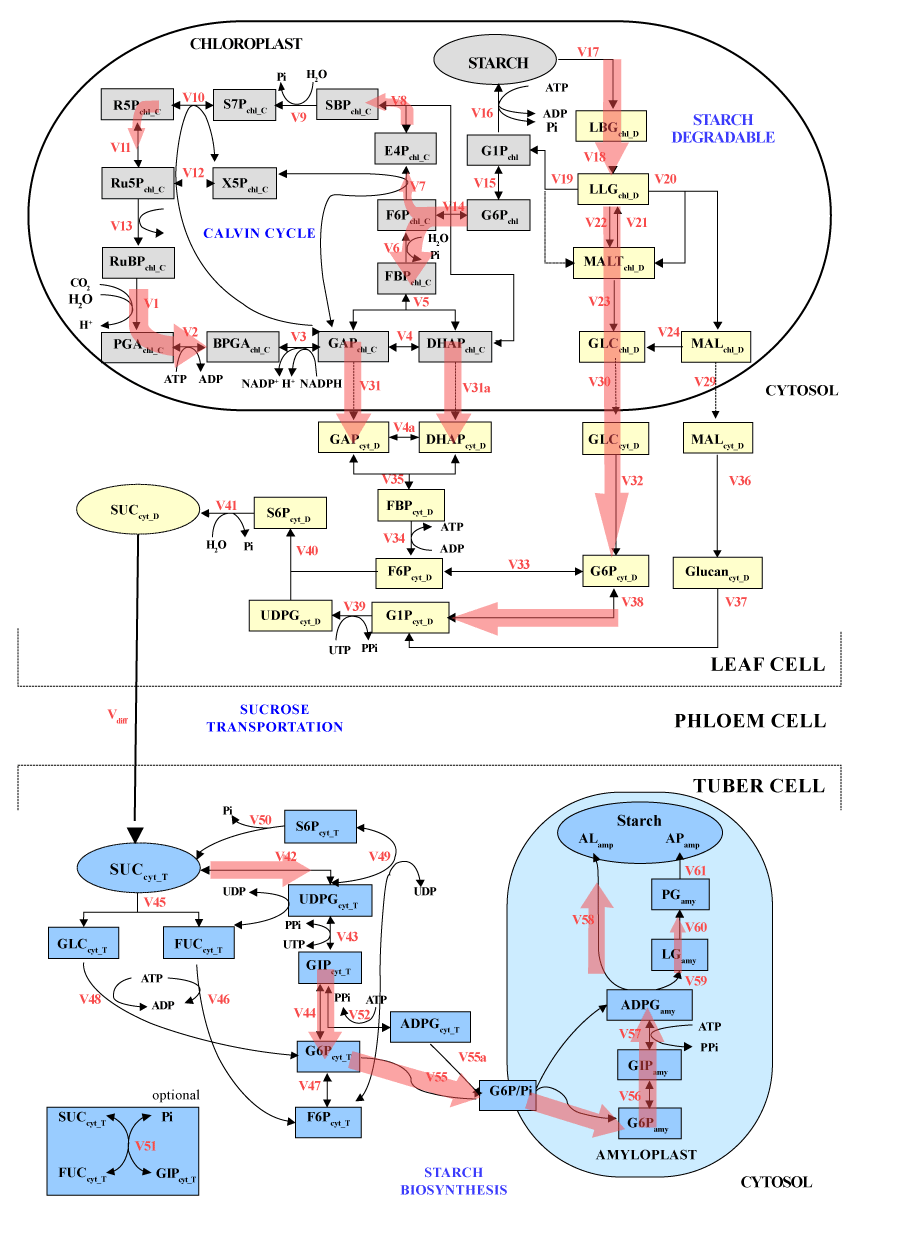
| Figure 10: The proposed formal metabolic route response for starch production under high concentration of CO2. The scheme illustrates the potential, formal metabolic route for starch production under high concentration of CO2 (red arrows, drawn corresponding to the grey arrows in Figure 9) that was proposed according to the simulations and analysis in Figure 9. |