 |
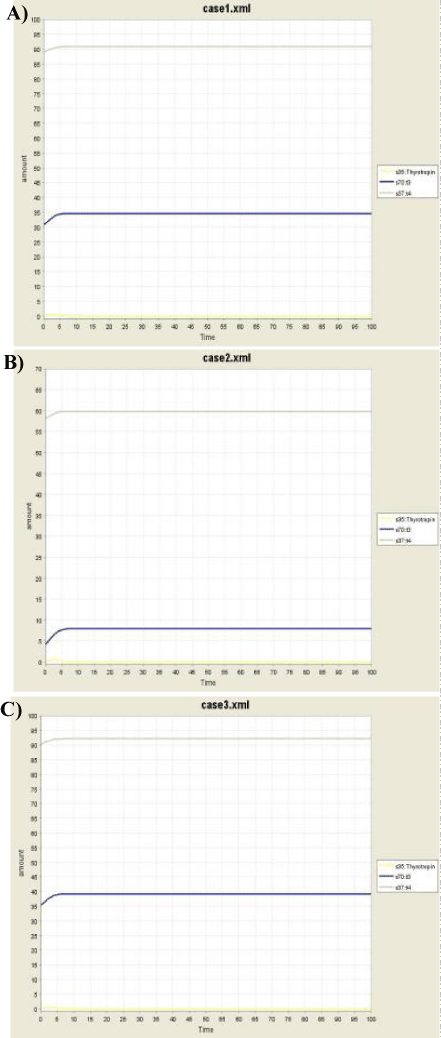
| Figure 6: (a),(b) and (c) Simulation result for three different cases of Hyperthyroidism related with cardiac disease, variation in concentrations of TSH, T3 and T4 with the time is shown in yellow, blue and grey color respectively. In Figure 6 (a), (b), (c) Simulation was performed using three different initial concentrations of TSH, T3 and T4. In all the three cases, we observed the same type of variation pattern for the three parameters i.e. TSH, T3 and T4. We can say that concentration of TSH, T3 and T4 were increasing with time and after 10 seconds it becomes constant |