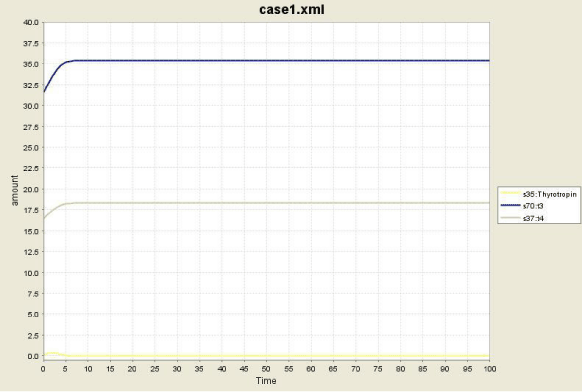
Figure 8:
Simulation study for GD presenting patient with pseudo tumour cerebri, variation in concentrations of TSH, T3 and T4 with the time is shown in yellow, blue and grey color respectively.