 |
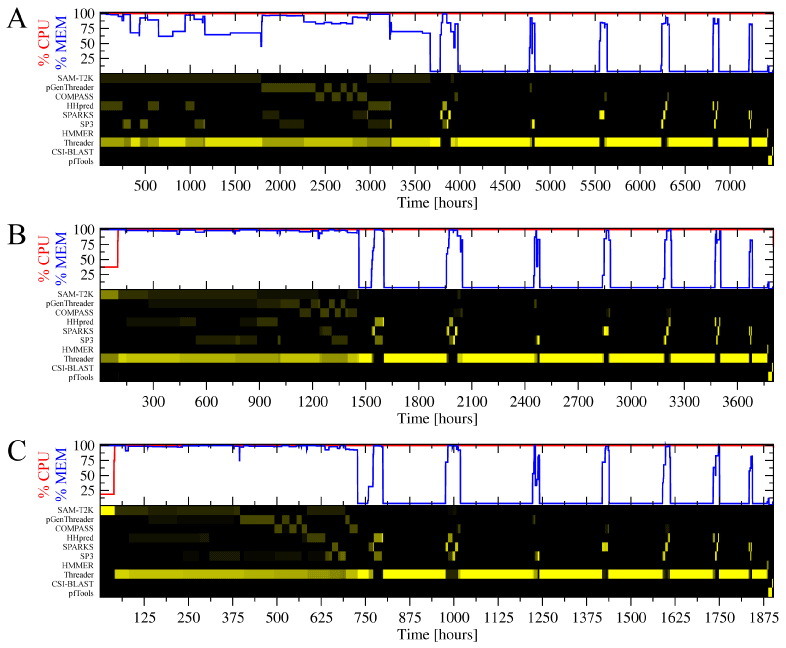
| Figure 3: Simulated queuing system dispatching threading jobs for E. coli proteome. Calculations are virtually processed using (A) 8 cores/8GB RAM, (B) 16 cores/16GB RAM, and (C) 32 cores/32GB RAM. For each composite figure, the top pane shows the utilization of computing cores and memory as a function of the machine operation time. The bottom pane shows the fraction of cores assigned to individual threading algorithms at a given time; color intensity matches the fraction: black – 0.0 (no cores), bright yellow – 1.0 (all cores). |